Demographic & Housing Trends in the Atlanta Region’s Growth Centers
Following Historic Trends in the Region's Cities

Two weeks ago, the New York Times published an article by Conor Dougherty titled “America Needs More Sprawl to Fix It’s Housing Crisis” an intentionally provocative title, which yielded many disgruntled LinkedIn posts from other planners in my network over the next week. I am thankful to work for a firm that likes to debate ideas like this internally. The first person to post about it in our all-office Teams chat came out in favor of what the article was saying.
After giving the article a read, I had many thoughts; I felt that I understood where the article was coming from, after all the crisis of availability is clearly overwhelming most major cities in America today. It is so overwhelming that supply side solutions to the housing crisis are being embraced across the aisle because the crisis is just that bad. It is true that it's often harder and more expensive to build in the urban core than to build further out. Looking at the migration data that I posted a few weeks ago, I saw that across the southeast, a lot of migration (not necessarily growth, but likely correlated) is happening in the suburbs and exurbs.
I feel that to say that we need to continue to sprawl is just to say let's keep doing what we're already doing, which isn't actually solving the crisis. We haven't made sprawl illegal in most places except those rare few cities that have urban growth boundaries. What he's saying is true, it is easier to build out in the suburbs and beyond. If more sprawl was the answer to the housing crisis, we wouldn't have a housing crisis I don't think. I don’t think that sprawl needs defenders. The reason it receives such frequent criticism is because it is largely hegemonic.
I also felt that Dougherty ignores the fact that the first wave of suburbanization he talks about in the article happened in places that are now within incorporated limits of core cities. The next and every successive wave of suburbanization has occurred outside of the city limits of core cities. While I personally just think sprawl is ugly, I think my true qualm with it is the lack of coordination inherent in sprawl. Every little city is its own little kingdom that can restrict growth.
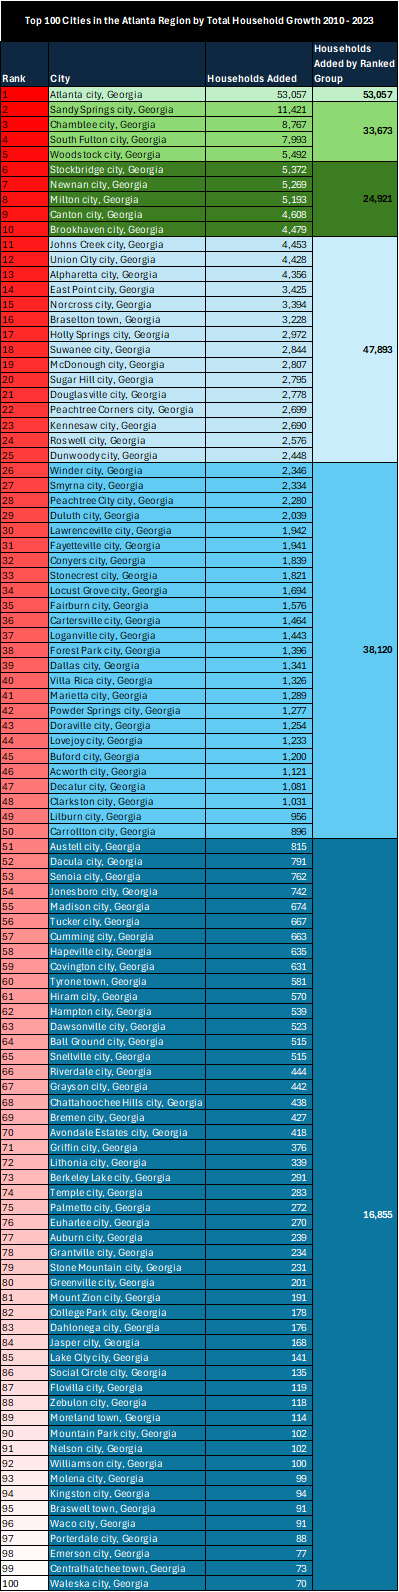
Dougherty’s article talks about excessive regulation and the difficulties that adds to development in core cities, but it fails to consider that having 50+ cities in a region, all with their own zoning and land use controls is also a huge hinderance to building housing. That being said, when I fell down an Atlanta regional data rabbit hole a few week ago, I seemed to find that many of our cities in the Atlanta region that have populations between 10,000 and 30,000 have punched above their weight on adding housing to the region.
I think that’s inevitable that we are going to keep sprawling, I'm certainly not worried about that stopping. I think it's an oversimplification to say that continuing to sprawl, even sprawl that's anchored by walkable downtown nodes are going to naturally get us out of the housing crisis. We're at such a desperate juncture in terms of housing affordability and availability, I think it's easy to say that the poison is going to cure us.
The article got me curious about a few things that I wanted to understand better about the Atlanta region specifically. While Dougherty’s article is just about sprawl in general, what it really made me think about was the impact of fractured local controls over land use and the way that this impacts the Atlanta region’s growth. Broadly, what I wanted to understand better were:
What share of the 29-County Atlanta region’s growth in households, housing units and specific types of housing units has occurred in cities as opposed to unincorporated parts of the metro.
Cities, at least in theory, suggest centrality; cities are purposeful and they draw people in. If in theory cities carry the burden of greater growth pressures, how have they handled these pressures?
Briefly, my methodology was to examine the change in several different variables for the Atlanta region overall and for every specific incorporated place within the metro between 2010 and 2023. I utilized these years because the while there are several distinct chapters and real estate cycles that have occurred between 2010 and 2023, all of these periods have led to the current state of crisis.
I was careful to remove Census Designated Places from my analysis which are not incorporated and therefore possess no control overall local land use and zoning. Additionally, the Atlanta metro has seen a significant number of cityhood movements since 2010, with the creation of cities like Peachtree Corners and South Fulton. For these newly formed cities, since I was interested in what is happening in places with local control over land, I only looked back to the first year for which there is data during the period 2010 to 2023 so not to give these cities “credit” for household growth and housing unit production that was effectively “grandfathered in.”
Summary Findings
More than half of the region’s housing unit production between 2010 and 2023 occurred within cities throughout the region
While the region’s cities were responsible for 63% of Townhome & Plex unit production and 79% of Large Multifamily unit production, production of these types of units were highly concentrated in the top third of cities in the region producing these units, which are generally more centrally located within the region, suggesting that housing inventories are only truly diverse in only a handful of the region’s cities
While cities can be fantastic lenses for intensifying residential development, their location within the region is centrally important as to whether they are going to serve as a deterrent or accelerant to the diversification and densification of the region’s housing inventory. Cities closer to the region’s center, due largely to undeniable demand pressures, must embrace density or else risk dire housing market and economic failures, while cities further away from the urban core utilize land use controls to ensure that the densification that the region needs is not occurring in their communities
Between 2010 and 2023 the region’s white population decreased overall, however the region’s cities were net positive for growth in white residents
The top ten growth cities in the region exclusive of the City of Atlanta experienced a much more balanced pattern of household growth by income group than cities that experienced less household growth. These cities’ housing diversity may have played a role in the retention of lower-earning households
The top twenty-five growth cities in the region, exclusive of the top ten, experienced the highest growth in the highest earning income group between 2010 and 2023. Almost all of these cities are located in Atlanta’s northern suburbs either in north Fulton, Cobb or Gwinnett
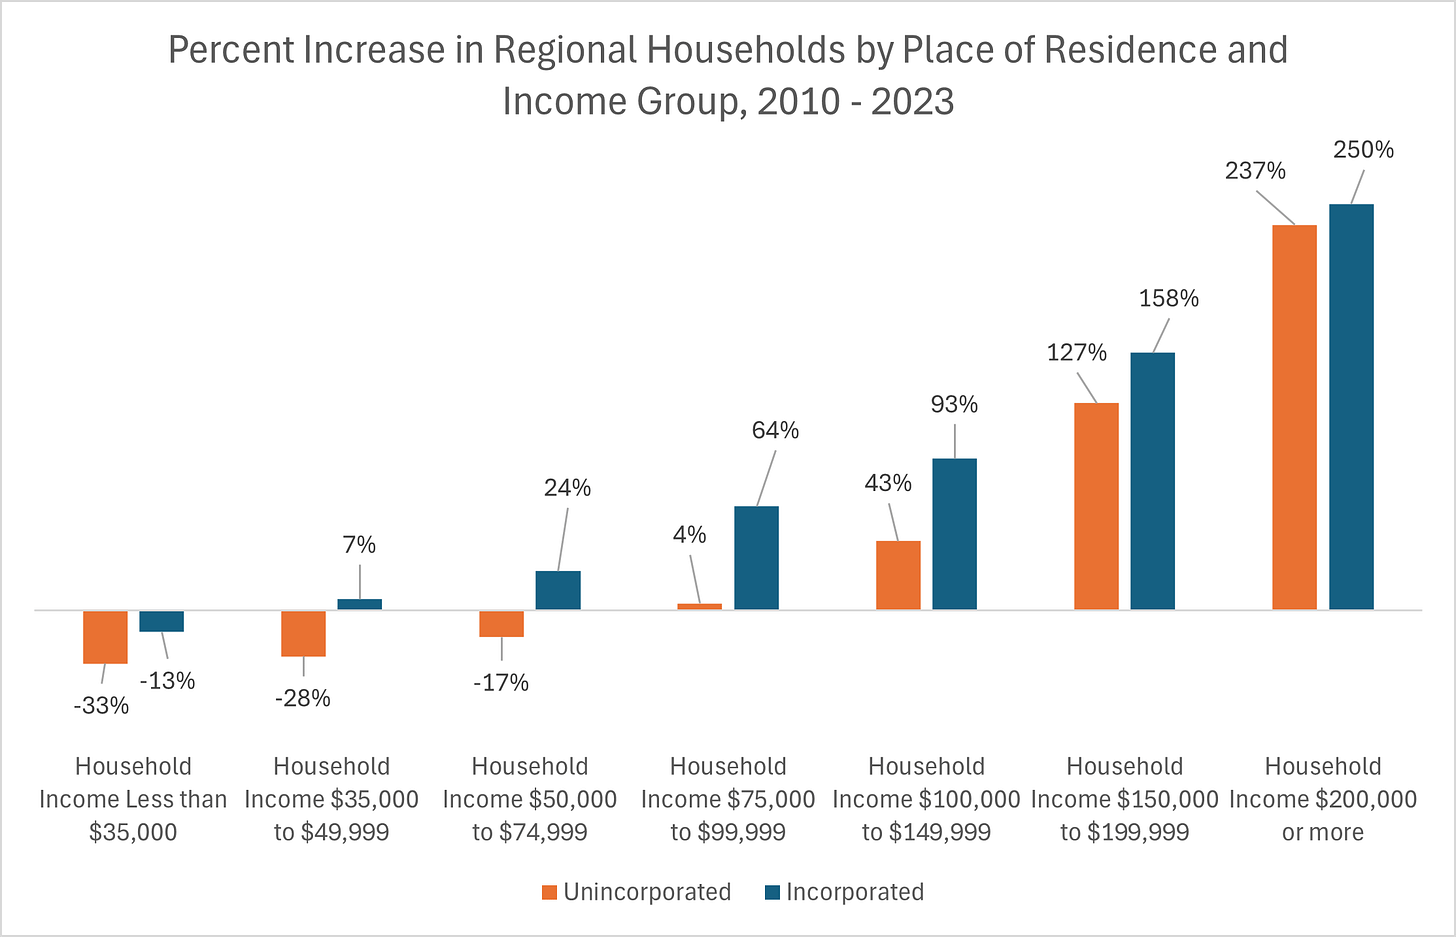
The unincorporated parts of the Atlanta region experienced significant losses of households earning less than $75,000 and only moderate gains in households earning between $75,000 and $100,000. This reflects two things:
Cities allow for denser development patterns, allowing for greater affordability to be achieved
Cities allow for more focused and conscious efforts to preserve and create affordable housing and likely have better awareness of affordability priorities within their limited boundaries in contrast to unincorporated portions of the region’s counties
The lower growth cities (cities eleven and above) experienced slightly higher percent growth in rentership over ownership despite adding less townhome, plex and multifamily units. Single-family detached units dominated the new housing units added to these cities’ inventory over the period, which are traditionally associated with ownership. Wage stagnation, worsening inequality and corporate entry into the ownership of single-family detached homes are all contributing toward this trend
Atlanta Regional Growth 2010 – 2023
The dual crises of availability and accessibility that we are facing in the Atlanta metro and in many other metros across the country can be summarized by four lines on one graph:

Since 2010:
The growth of households has outpaced the growth of housing units.
Median home values have increased at a far greater pace than median household incomes, with the disparity only becoming severe starting in 2020.
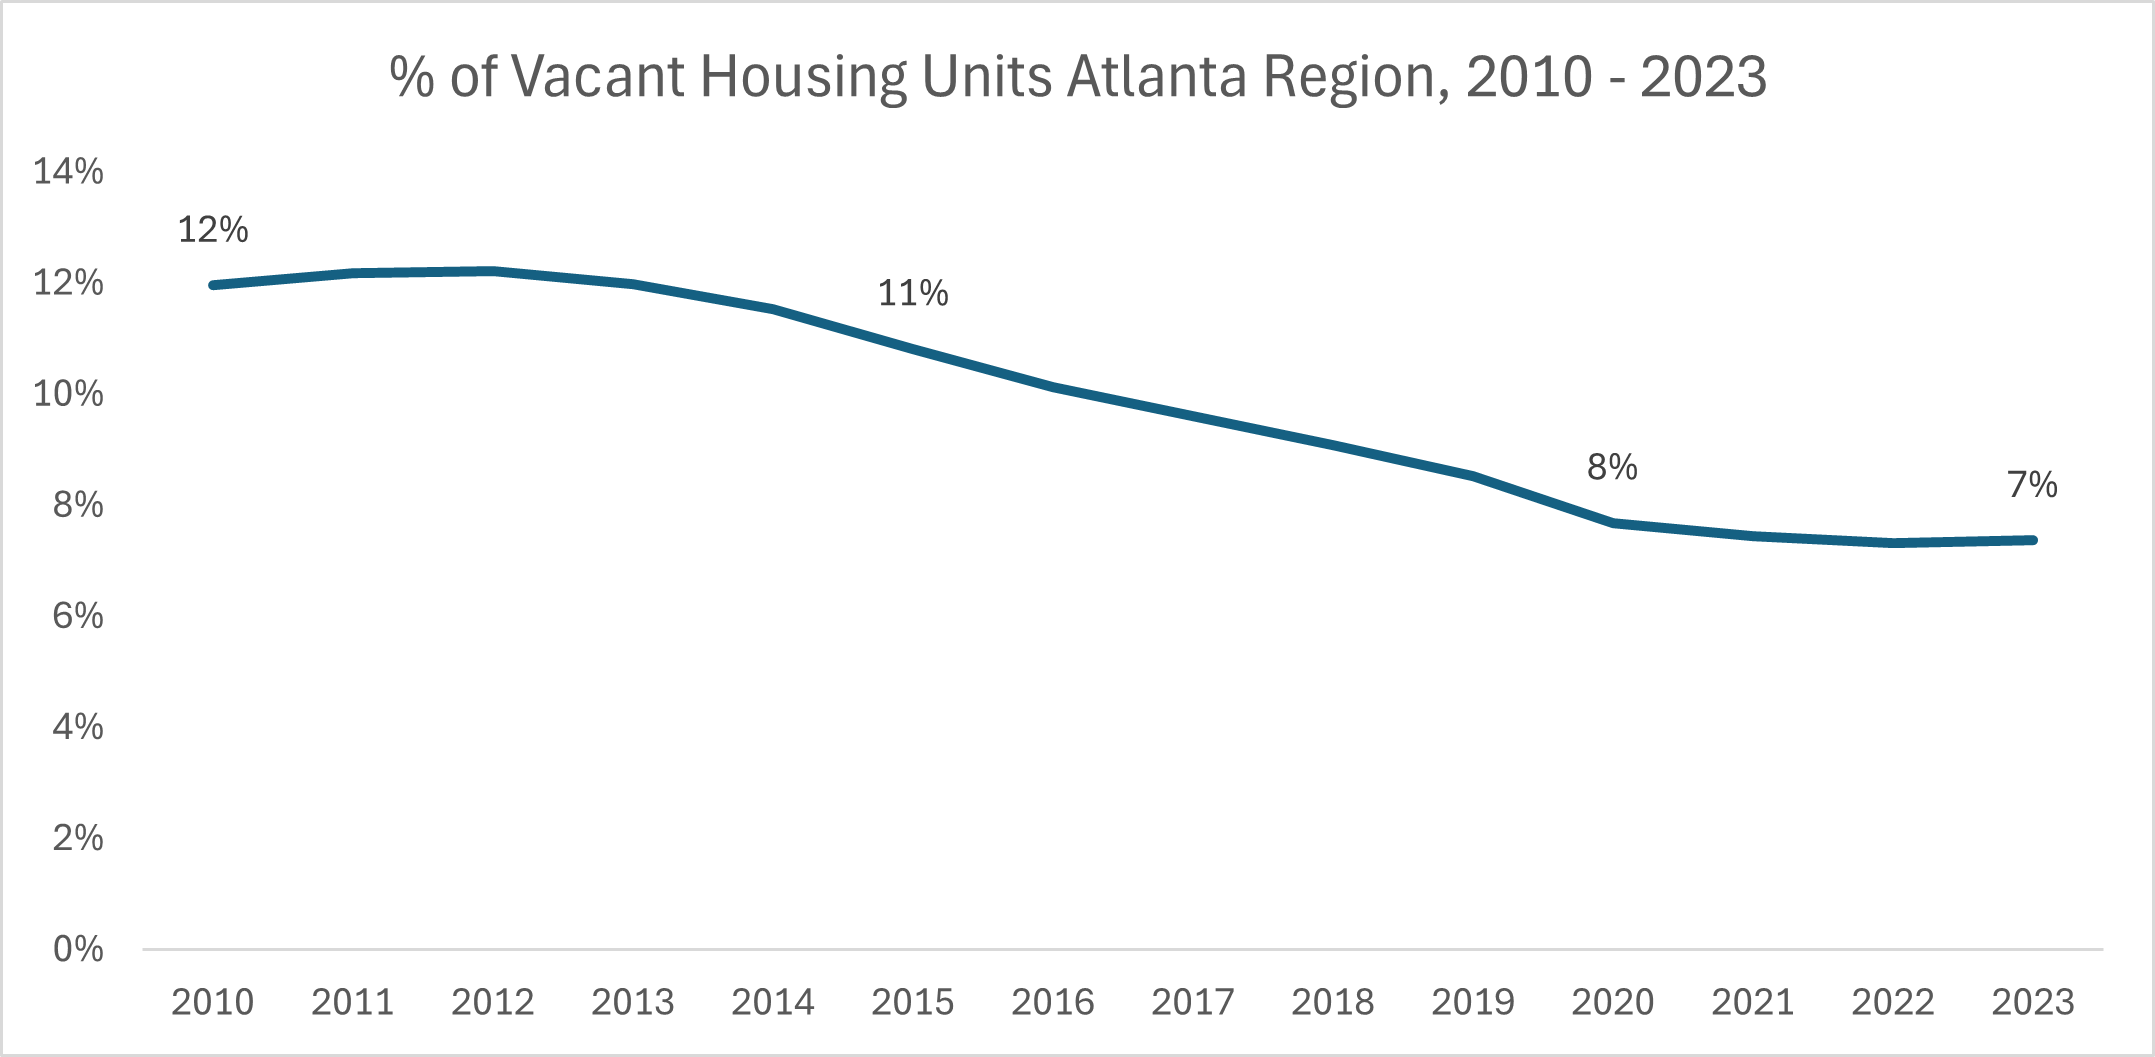
During this period, the percentage of regional housing units that are vacant has decreased from 12% in 2010 to 7% 2023. This aligns with the consensus that our housing inventory has become increasingly tight since 2010.
Growth in households has consistently outpaced housing unit production except for in 2021, when the market attempted to overcorrect for a decade of under-production.

Between 2010 and 2023, the ratio of housing units to households dropped from 1.14 to 1.08. While it is impossible to say definitively whether one ratio of housing units to households is healthier than another, it feels fair to assume that when the ratio was closer to 1.14 there was more breathing room within the Atlanta metro’s housing markets.
While the desire to return to a previous state of being is very popular right now, I would never suggest that doing so was necessarily desirable. However, if we were to collectively agree that achieving a higher ratio of housing units to households that resembled that ratio in the year 2014, this would mean drastically increasing our annual housing production over the next decade to not only satisfy the consistent, growing demand for housing from new households, but also to backfill to compensate for the under-production that has occurred since 2010.

Housing Production in the Atlanta Region’s Cities
The following tables and maps are all self-contained in the sense that the one pertaining to All Housing Units considers All Housing Units in the region as its universe, while the one pertaining to Single-Family Detached Units considers all Single-Family Detached Units its universe and so on. The first table which shows them all together has this same logic for each column and the percentages are not percentages of total housing but just total housing units for each category.
Findings:
More than half of the region’s housing unit production between 2010 and 2023 occurred within cities throughout the region
The region’s cities are generally keeping pace with their share of household growth
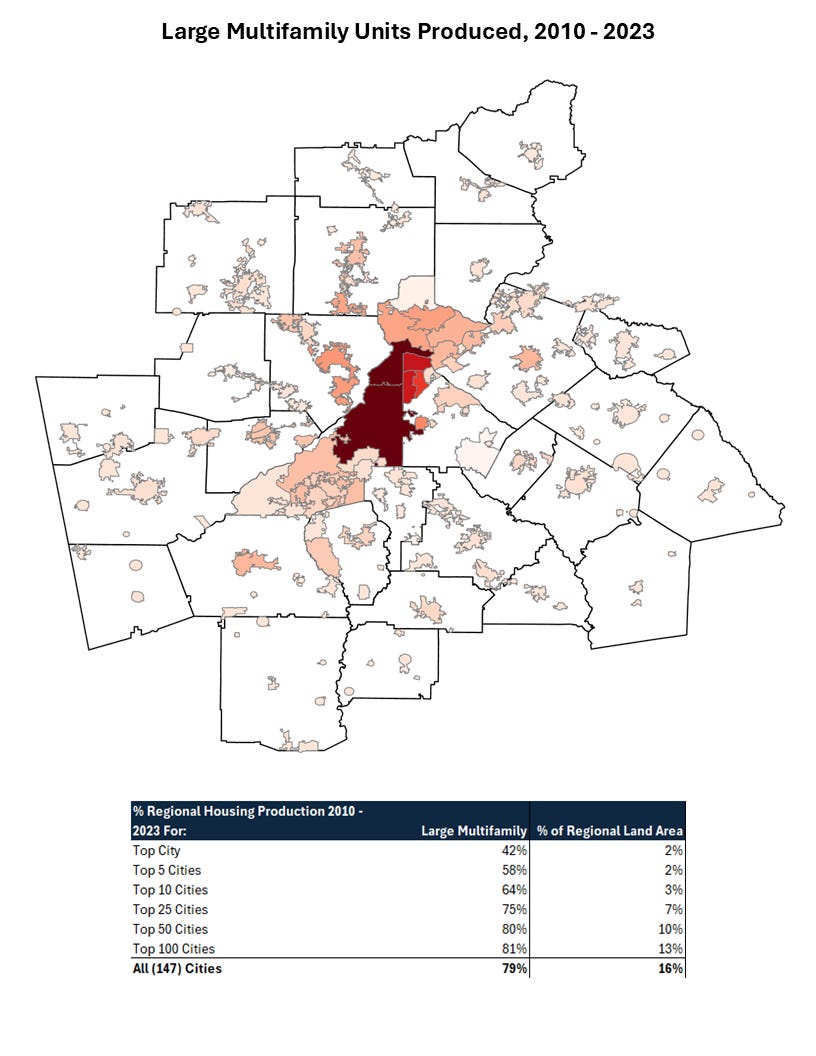
While the region’s cities were responsible for 63% of Townhome & Plex unit production and 79% of Large Multifamily unit production, production of these types of units were highly concentrated in the top third of cities in the region producing these units, which are generally more centrally located within the region, suggesting that housing inventories are only truly diverse in only a handful of the region’s cities
In Atlanta and in other cities close to the region’s center where growth pressures are most significant, there has been a staggering loss of Small Multifamily units, which many would generally identify as “Missing Middle” housing types
Cities account for only 16% of the land area of the region, but 53% of total housing unit production and 79% of multifamily unit production


While the table shows percentage of units lost across the region, this map symbolizes losses in the lightest color with darker colors representing cities that actually did add small multifamily units 


Demographic and Housing Trends in the Atlanta Region’s Growth Centers
The final section of this analysis seeks to examine trends in total housing production, housing unit production by type, change in racial composition, change in household income and finally growth of homeownership vs. growth of rentership. The rankings that are referenced refer to the rankings of cities in the region according to total household growth.
While these grouping are somewhat arbitrary, what I was trying to understand was how cities in different tiers of household growth were doing in terms of housing unit production and demographic transition – the piece that is notably missing from this analysis is an analysis of ranked groups according to age groups. The arbitrariness of these ranked groups may potentially obscure trends specific to one city or another.

Findings:
Every grouping of cities in the region added fewer housing units than households between 2010 and 2023
The largest gap between household growth and housing unit growth occurred within the City of Atlanta, which saw the highest total number of households added across the period
Significant gaps also presented within cities with relatively high household growth (cities 11 to 50), making the cities in the top third in the region for household growth a major source of the region’s overall housing unit gap.


Findings:
While all of the top 50 cities in the region for household growth added some large multifamily units, the vast majority of these units were produced within the City of Atlanta
The top ten cities exclusive of the City of Atlanta experienced a much more diverse pattern of housing unit production than other cities in the region, with significantly less single-family detached units than lower-growth cities and significantly more townhome and plex units
Outside of the top ten cities in the region, single-family detached units were the dominant form of housing unit added between 2010 and 2023
While cities can be fantastic lenses for intensifying residential development, their location within the region is centrally important as to whether they are going to serve as a deterrent or accelerant to the diversification and densification of the region’s housing inventory. Cities closer to the region’s center, due largely to undeniable demand pressures, must embrace density or else risk dire housing market and economic failures, while cities further away from the urban core utilize land use controls to ensure that the densification that the region needs is not occurring in their communities

Findings:
Between 2010 and 2023 the region’s white population decreased overall, however the region’s cities were net positive for growth in white residents
The City of Atlanta added a far greater number of white residents between 2010 and 2023 than black residents
While the top ten cities in the region exclusive of the City of Atlanta added white residents between 2010 and 2023, they added far more black residents
Most cities in the region that experienced little to moderate growth in households added a significant number of black residents while losing white residents

Findings:
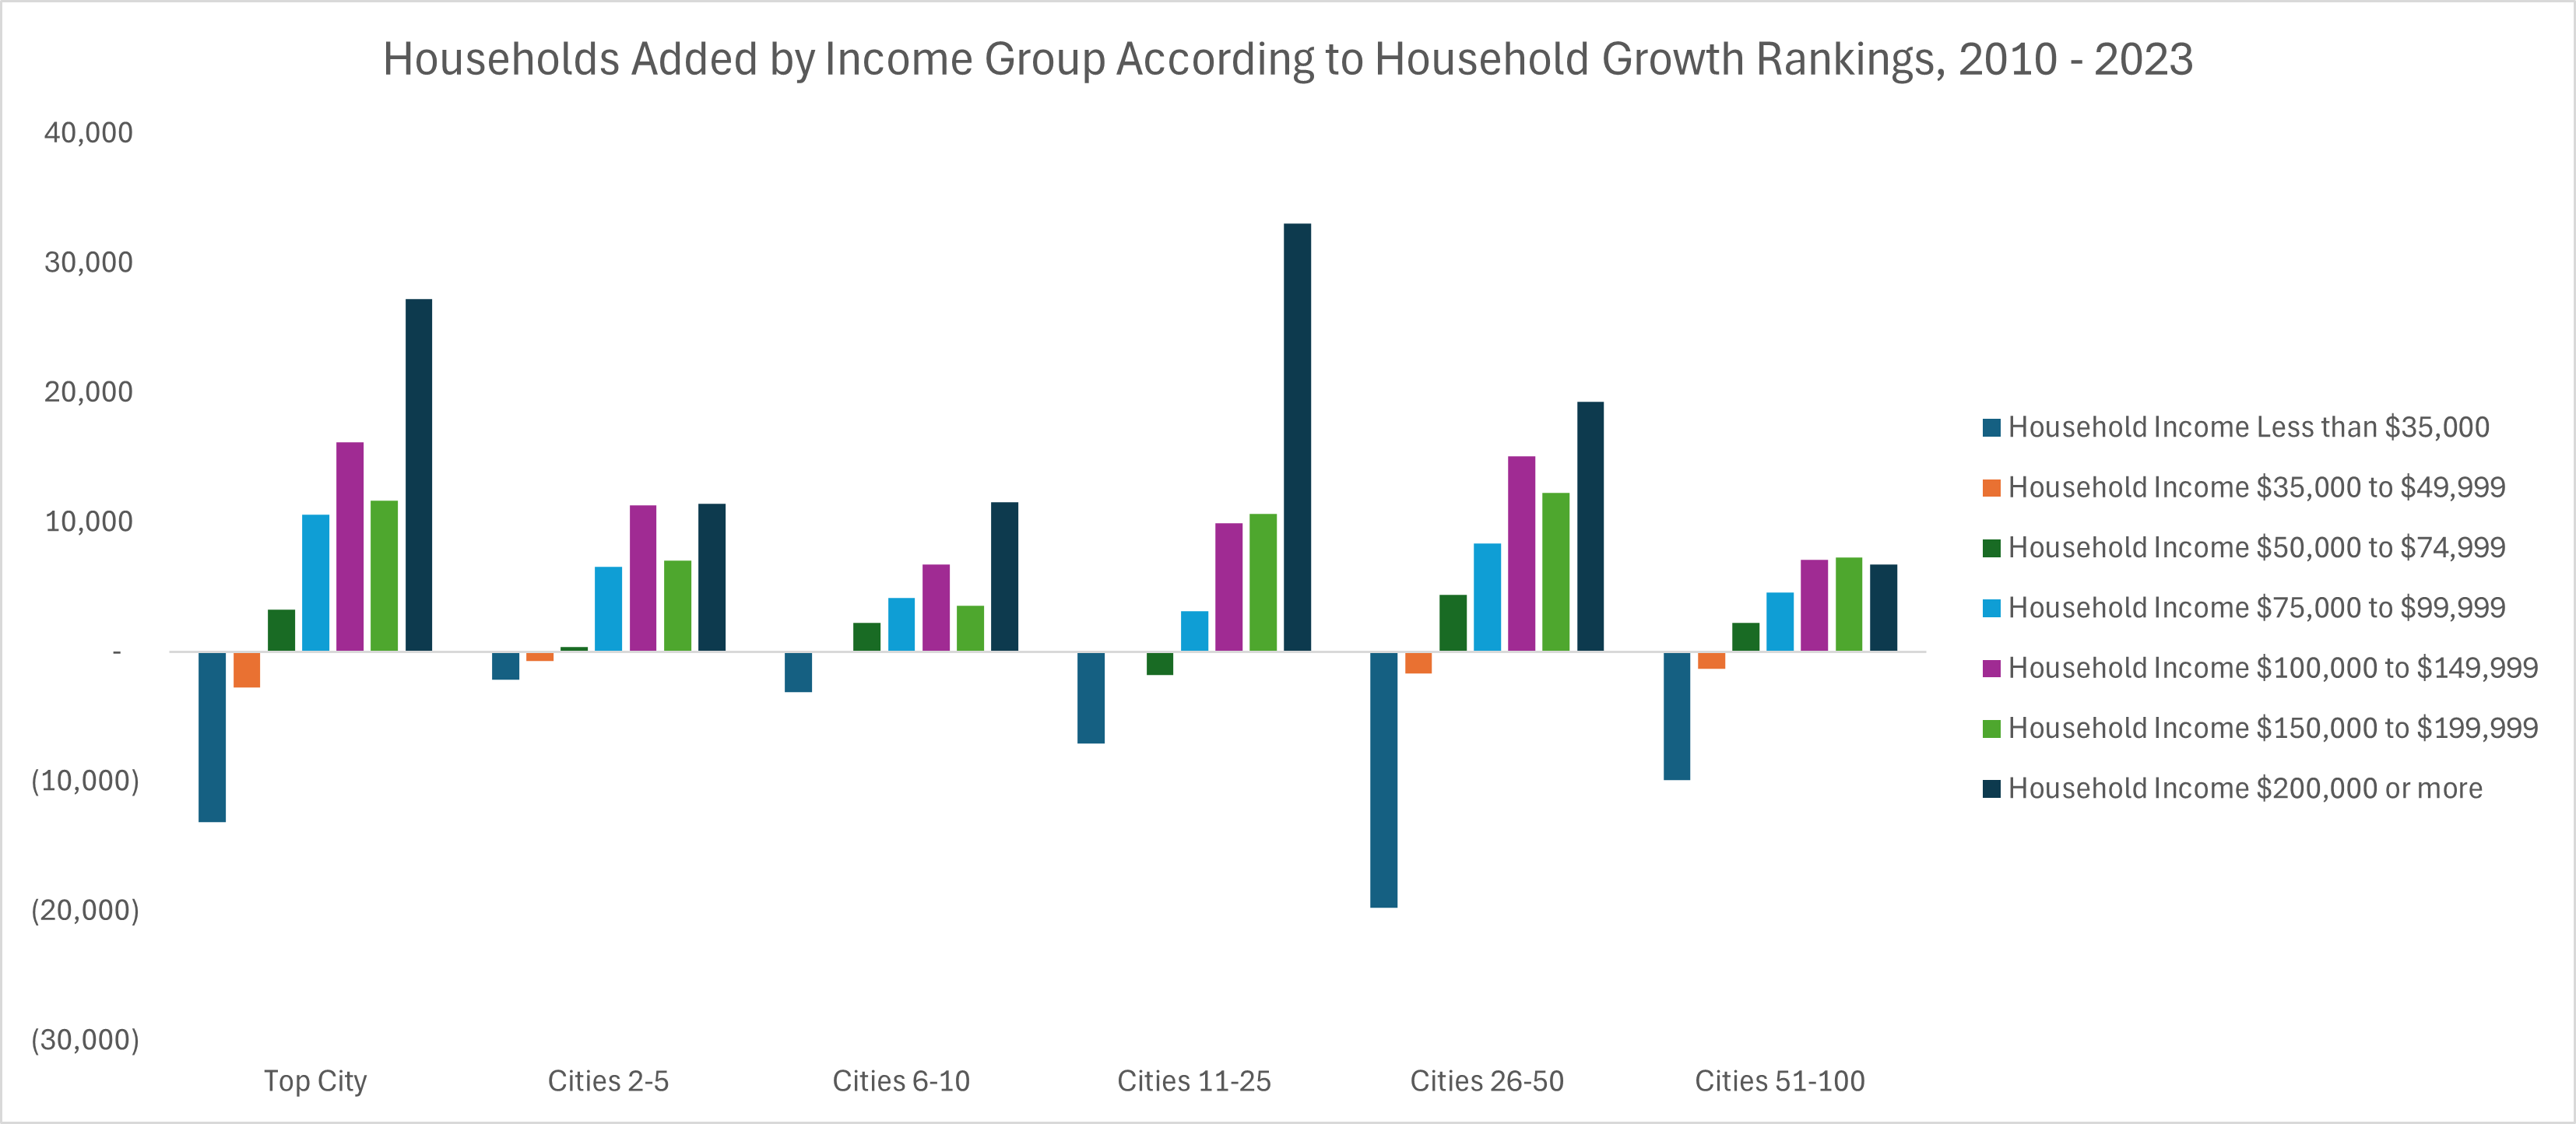
The City of Atlanta added a significant number of households with household incomes greater than $75,000, while it lost many households earning less than $50,000
The top ten growth cities in the region exclusive of the City of Atlanta experienced a much more balanced pattern of household growth by income group than cities that experienced less household growth. These cities’ housing diversity may have played a role in the retention of lower-earning households
Cities 11-25 experienced the highest growth in the highest earning income group between 2010 and 2023. Almost all of these cities are located in Atlanta’s northern suburbs either in north Fulton, Cobb or Gwinnett
Cities 11 and above experienced significant losses in households earning less than $35,000, which may be related to the lack of diversification of these cities’ housing inventories

Findings:
The unincorporated parts of the Atlanta region experienced significant losses of households earning less than $75,000 and only moderate gains in households earning between $75,000 and $100,000. This reflects two things:
Cities allow for denser development patterns, allowing for greater affordability to be achieved
Cities allow for more focused and conscious efforts to preserve and create affordable housing and likely have better awareness of affordability priorities within their limited boundaries in contrast to unincorporated portions of the region’s counties
Findings:
Growth in owner and renter occupied units within the City of Atlanta between 2010 and 2023 were relatively matched, with renter occupied units increasing at a slightly higher rate than owner occupied units
The lower growth cities (cities eleven and above) experienced slightly higher percent growth in rentership over ownership despite adding less townhome, plex and multifamily units. Single-family detached units dominated the new housing units added to these cities’ inventory over the period, which are traditionally associated with ownership. Wage stagnation, worsening inequality and corporate entry into the ownership of single-family detached homes are all contributing toward this trend
The top ten highest household growth cities exclusive of the City of Atlanta experienced significant percent increases in both owner-occupied units and renter-occupied units.
Cities two through five are significant outliers in the overall trend where renter-occupied units experienced greater percent increases than owner-occupied units, a phenomenon which may be tied to heightened diversification of these cities’ housing inventory through new deliveries since 2010, particularly townhome and plex units
While historically the perception around renters has been that they are poorer and possibly undesirable, as wages have stagnated and housing prices have risen, rentership has become a necessity for a larger share of working-class households. As the region continues to grow, it will be important that the region’s cities consider policies that allow adaptation to this new economic reality by allowing more affordable, likely higher density rental units to be created if they hope to retain working age households and families, which serve as the backbone of local communities’ retail ecosystems and economic bases.
Appendix: Household Growth Rankings